Thursday, February 9, 2012

Usability Metrics Redux

There are a number of more thoughts about Heatmaps and Clickmap technology.  I was reading Avinash's latest blog post and stumbled across the new Google Analytics "In Page Analytics".  Wow, click maps right there!  Very cool.  This shows the clicks on my other web site and can give me some insight into where people are clicking.  The good part is the "below the fold" orange bar that shows only 10% of people are scrolling down and clicking.  This is very useful and more helpful than the pretty heat maps out there.


In my summary over the past month, these are the observations that I have with the whole click and heat map world.

  • Heatmaps are focused on pages. They are not process or session based and do not focus as much on objectives ("Did they convert"?) Still, in some cases,  mainly experimental, I can leverage them for a short term project. In most blog purposes, heatmaps are not that useful. 
  • Scalability is tricky.  Few click maps can handle large loads so they sample your customers. This is okay, but still, full analytic tools like GA or Tealeaf give more useful data. 
  • Mouse tracking cool, but why? I just can't get my brain around it,  but do I really need to see all the mouse-over or follow the mouse replays?  Wouldn't a click map tell me more useful and quantitative stuff
  • Click map replay. It is interesting, but how to you identify which one you want to view?  There are sites that allow you to replay your clicks and mouse events, but how do you select them? Randomly?  If you want replay, use Tealeaf or Coradiant that allow you to search, select and then replay end user sessions.
  • Got AJAX? Well, none of this technology really works with dynamic sites yet.  They rely on static pages or slowly moving pages.  So blogs and content sites are fine, but if I'm selling or providing news, not so sure this will be valuable.
While heat and click maps are pretty cool, I think using conversion tools like web analytics or Tealeaf to determine pages of interest, perhaps a heat map or two then.  But then using A/B testing will be more useful. Which page will increase conversion or acquire more customers? 

Tuesday, January 10, 2012

Why Heatmaps?

More and more of my customers have the request for heatmaps and usability metrics. While my snide comments of "eye candy" were my own personal thoughts originally, I decided to think and study the use of heatmaps to help improve the customer experience.

What Do People Do with Heatmaps?
My first real thought was "what do you really do with a heatmap"? A lot of folks in the Search Engine Optimization space use them to check their ad effectiveness. As seen below, the hotter part of the screen (red) indicates where the majority of users clicked. You can see on the far left, some clicks in green, but most are around the top of the page, to the left.

Okay, if I'm placing ads, I get this.  In the end, what people want is some other way to visualize where people are navigating to make the page "better".

What are People Hoping to Gather?
I have asked my customers and most of the metrics and statistics they are looking for are as follows:
  • % of people who click an item or menu
  • % of people searching vs. browse the page
  • People who are scrolling down
  • Tracking mouse overs and movements
  • Do people use all the fields presented?
  • Do they click the call to actions
  • Do they navigate with the sidebars or heading tabs
  • Are the carousels or other widgets being used?
What are Good Questions to Ask?
While a bunch of metrics are great to have and save for analysis paralysis, this leads us to the place to begin, what questions do we really need answers to?
  • Does traffic source influence which clicks do people make?  Do I need landing pages for every campaign or can I just use the home page and everyone gets what they want?
  • Do people click on the image or text ads on the site?  Do people even click ads?
  • Are people clicking on the main call-to-actions on the page?
  • Are key components grouped together nicely?  This will help to prioritize the page layout.
  • Are people finding what they want quick enough? Are they clicking on "About Us' to get to "Contact Us"
I realize a lot of marketing folks really like heatmaps since they convey a pretty picture, but like any tool, without the right context and questions, they tend to only generate red herrings (tangents that are a fun journey but not that useful).  The best use of heatmaps is to establish a process for usability metrics and a strategy to integrate with Multivariate Testing and Customer Experience Management systems.


Monday, December 19, 2011

Too much AJAX

In my role as a customer experience consultant (with Tealeaf), I get to research many types of web sites built by a variety of organizations. Focusing on usability issues, I get to analyze web site implementations where the use of AJAX is a big factor today. Alas, too many sites have gone wild and crazy and deliver too much AJAX.

Back in the old Web 1.0 world of ten years ago, developers broke business processes into nice, consumable chunks called pages. It was easy to break down a business form into nice logical pieces that were easy to implement and easy for customers to understand. For example:
  • A loan application. You filled out your personal information on one page, next your financial, next your employment, and finally a confirmation page.
  • Buying a product. A search page, product description, shopping cart, and purchase pages.
  • Booking a hotel. Enter your travel dates, desired location, search, select, and purchase.
All nice and logical, right? The greatest part is that the sites are easy to support as well as functional. If a form needed fixing or page need tweaking, you only had to troubleshoot that page in the process. Making changes and rolling them out was not that complex or earth-shattering. Life cycle management of Web 1.0 sites was reasonable, easy, and cost-effective.

But the introduction of too much AJAX now replaces this easy life cycle with complex, insupportable models. The worst is the insurance industry. They seem infatuated with taking very complex, ten page processes and slamming them into one page AJAX nightmares. In order to debug a problem on the eighth end user page, the developer has to start at the first page, enter in pages of test data just to get to the eight page. What used to take 10 seconds to test now takes minutes. Over and over again. And we haven't gotten this into the user's hand yet! Ouch!

Now try compound all this client-side AJAX in all the tablets, phones, and laptops coming out. Yikes! To me it seems like a plot by the consulting and design firms to keep fat support contracts to support all this spaghetti code. Yuck. Too much AJAX.

Thank goodness some sanity is out there. Retail sites seem to get it and avoid too much AJAX. Also, the new design models based on HTML5 and Responsive Design appear to lead the next generation back into supportable design models, with simpler code implementation and avoiding the too much AJAX applications that have 80 JavaScript files to build a business process in the browser.

Best Practices

In my travels with my customers, I've come to understand where AJAX in a page makes sense. Here are just a few:
  • Vehicle look-up. When I pull down a menu, an AJAX call fills it with only the cars I need.
  • Search terms as I type. As I type "laptop", the search bar autofills other searches to save me time.
  • Content display as I navigate. As I interact on the page, content appears or pops up that is relevant to me. AJAX calls make this possible, improving my customer experience.
  • Inventory checks. On the same product page, knowing it is really in stock is very helpful. Ditto for shipping charges and taxes.
  • Filtering choices. As I select certain dates, only the Hotels with openings are listed, as I filter on brands, the page refreshes with content.
Using AJAX, just the right amount, makes for a wonderful site experience. Hopefully the mobile and tablet evolution will return us to the middle, blending the best of web 1.0 and web 2.0, giving us sites that are:
  • Sexy interfaces that are fun to use
  • Easy for developer's to troubleshoot and support
  • Leveraging the devices that I want to use
  • Keeping support costs down

Friday, March 12, 2010

Performance Challenge: The Misconfiguration

There are a number of performance challenges that many websites find themselves, but nothing worse than the Misconfiguration. Last week, a customer noted that "my site seems very slow." So I fired up Gomez and started testing. The page was very heavy at over 1.5 Mbytes, but still, 70 seconds on average was terrible! I drilled into the data on behalf of the customer and saw swings of excessively long Content Download times, which usually indicates something is misconfigured with the web server. Note the graph showing the oscillation up and down. Not only are things slow, but swinging wildly, totally inconsistent.

So how did things get fixed?

The engineers looked at the switch ports and found this:

#sho int g2/370
GigabitEthernet2/370 is up, line protocol is up (connected)
Hardware is C6k 1000Mb 802.3, address is 001f.ca6f.8424 (bia 001f.ca6f.8424)
Description: serverwww:eth0
MTU 1500 bytes, BW 100000 Kbit, DLY 10 usec,
reliability 255/255, txload 1/255, rxload 1/255
Encapsulation ARPA, loopback not set
Keepalive set (10 sec)
Full-duplex, 100Mb/s, media type is 10/100/1000BaseT
input flow-control is off, output flow-control is off
Clock mode is auto
ARP type: ARPA, ARP Timeout 04:00:00
Last input never, output 40w2d, output hang never
Last clearing of "show interface" counters 00:21:11
Input queue: 0/2000/389/0 (size/max/drops/flushes);
Queueing strategy: fifo
Output queue: 0/40 (size/max)
5 minute input rate 0 bits/sec, 0 packets/sec
5 minute output rate 0 bits/sec, 0 packets/sec
4114 packets input, 4232945 bytes, 0 no buffer
Received 21 broadcasts (0 multicasts)
2 runts, 0 giants, 0 throttles
389 input errors, 108 CRC, 0 frame, 0 overrun, 0 ignored
0 watchdog, 0 multicast, 0 pause input
0 input packets with dribble condition detected
4400 packets output, 1192528 bytes, 0 underruns
0 output errors, 0 collisions, 0 interface resets
0 babbles, 0 late collision, 0 deferred
0 lost carrier, 0 no carrier, 0 PAUSE output
0 output buffer failures, 0 output buffers swapped out

So basically, the silly ports on the switch and the server were in a mismatch. Packets were getting dropped or munged between the switch and the server. After manually checking both sides and making sure everything was set, the performance impact was HUGE! Think of over 55 seconds on average. WOW!

So ... checking all the silly details gives us huge wins for the customer. Another misconfiguration win!

Thursday, March 4, 2010

Performance Dashboards

Back the early Internet age, I was a consultant helping build marketing data warehouses. There were a number of great spokes-persons of our niche industry, notably Ralph Kimball and Bill Inmon. Both published a lot of books and both educated many of us on critical data management issues. A rising star from those days was Wayne Eckerson, who became the Business Intelligence guru. Wayne published a great book, Peformance Dashboards, which really leverage the 1990's wave in data warehousing with the web analytics of this decade, blending the metrics to deploy business performance dashboards.
The key summary of this book is that dashboards, scorecards, metrics, monitoring, and analytics all get munged into one screen of information. Keeping the key things simple to understand makes it easier for the entire company to focus their efforts and work to making things better for the customer. The dashboard translates strategy into objectives, metrics, and initatives for each team to achieve.

My favorite dashboard that combines the world of the web, data warehouse, and basic business systems is that from the Indiana Musuem of Art.

They have combined all the great metrics to run their business on published it on the web. Just think how you could transform your web site infrastructure and make this your Intranet. All the employees (and even customers!) can see what is important to the company. Clicking on a KPI gives you the trends over time and they even have "cross-selling" references on the left of the page. Totally a wonderful example.

Thursday, March 26, 2009

Why Performance Benchmarking Matters

Benchmarking has been in business for dozens of years. It is known well in the retail industry, where phantom shoppers visit the competition and try to get intelligence on their pricing for certain products. And for years now, this discipline has been available to organizations with web sites, using a newer discipline of Performance Benchmarking.

So what is Benchmarking?


Benchmarking is an ongoing, systematic process for measuring and comparing the work processes of one institution to those of another, by bringing an external focus to internal activities, functions, or operations.

Benchmarking provides key personnel, in charge of processes, with an external standard for measuring the quality and cost of internal activities, and help identify where opportunities for
improvement may reside.

Now what is Performance Benchmarking?

Moving the classic discipline of benchmarking online, Performance Benchmarking uses various technologies to collect metrics for competing organizations in order to achieve competitive information. The first wave of Performance Benchmarking has leveraged synthetic monitoring tools from Gomez and Keynote. These companies provide the technology to systematically measure common metrics of different web sites in a way to compare them.
The most common metric used is Response Time, which measures how long it takes to download a web page. If you showed the above graph to your CEO and told him your biggest competitor was colored in Red, do you think you'd get the Content Delivery Network solution you have been begging for? Absolutely!

Benchmarking Provides Relevance

So let's try to review some real reasons to use Performance Benchmarking at your Organization:
  • Quantifiable metrics. Like getting prices information, Performance Benchmarking helps you understand where you rank against key competitors with actionable metrics.
  • Achievable Actions. When you choose to act, the results of your action should be easy to prove using the same benchmark. This allows you to determine appropriate usability and performance targets.
  • Solid Framework. No more squishy "I think we are getting better"or mushy metrics like Reduced Calls to the Call Center. You can understand competitive investments that will help your site and validate the techniques in context, in real-time.
Benchmarking is a Critical Success Factor

Digging deeper in the relevance for benchmarking, the metrics generated by the technology and process you leverage become critical for the following reasons:
  • Provides Shared Metrics. Everyone in the organization can see the results. Note the best benchmarks leverage a Business Process benchmark to really improve. This allows for alignment across the organization without every department measuring success in their own data silos.
  • Provides Context. By focusing on the benchmark results, prioritization, decision-making and goal-setting becomes much easier when the focus and context moves from "Upgrading the Web Tier" to "Our customers now can log in twice as fast". Nothing helps your improvement project as total focus on the End User.
  • Demonstrates Improvement Over Time. Once you start your benchmark, it is very easy to determine how your site is doing. Daily, weekly, monthly, and even annually. Since Gomez and Keynote provide easy-to-use web-based interfaces, everyone in the organization can get reports and emails showing how the site is doing. Good-bye to those huge dashboard projects that never get done.
How do you know that Performance Benchmarking will help?

Finally, you'll know when Benchmarking will help if any of these scenarios ring soundly inside your organization:
  • A Lack of clear prioritization describing which parts of the web application should be improved first,
  • Uncertainty regarding how best to compare against direct and indirect online competitors,
  • Little focus on the competition and what relative performance means to the business,
  • Only have anecdotal evidence that there is a performance gap versus the competition.
So, go out and Benchmark today!

Wednesday, March 25, 2009

Leverage YSlow for Performance

A couple of years ago, the smart folks at Yahoo realized a wonderful tool called YSlow. This is a plug-in for the Firefox browser that leverages another wonderful plug-in called Firebug. These two tools are a must for anyone in the business of web performance monitoring.

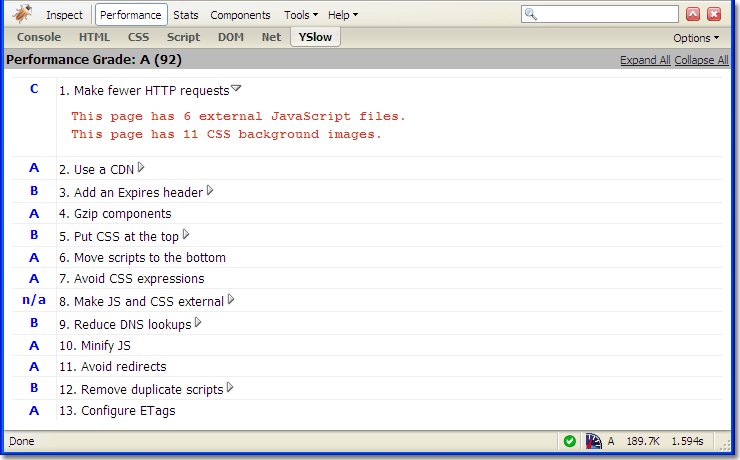
YSlow does a number of things, but the best place to start is the performance summary of a web page:


As you can see from the picture on the YSlow site, it will rank the web page under the YSlow 13 Performance categories. While it may not be the be-all end-all answer to solving your web performance tools, it really does give you a good start and a model to manage your web site's peformance. What is really the best part is that others can use it (since it's free to anyone) and get the same results that you do. The hardest part in discussing performance is establishing baselines to optimize and the Yahoo performance best practices are certainly worth leveraging.

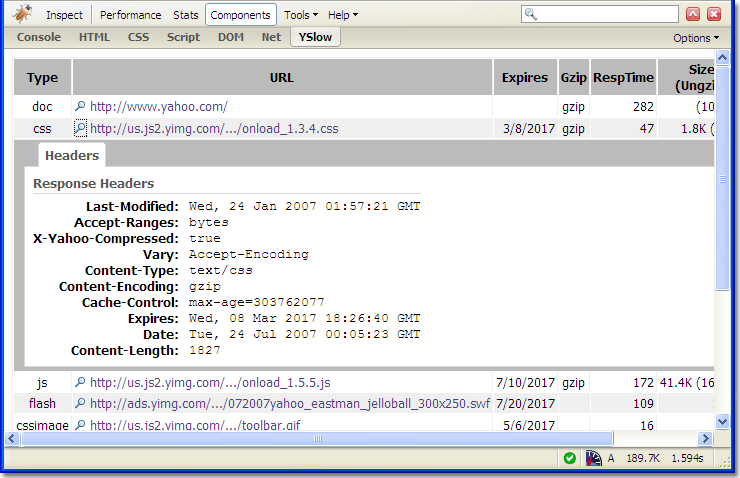
But the best part of YSlow is the full object download option. Yahoo calls this the web page components, but it shows you all the objects that compose your page in a "waterfall" view, which gives you a poor man's view of performance (versus the one provided by Gomez).

The component view shows you all you need to uncover the performance hairballs of your site. All the large objects, any MIME-type mismatches, IP address of the source. Awesome.

In summary, YSlow is an amazing tool and provides the Performance Analyst a wonderful tool to help customers optimize their web sites.

Tuesday, February 3, 2009

Why Performance Monitoring?

In understanding Service Levels for Web Sites, moving quickly to how to measure for SLAs, we quickly turn to Performance Monitoring to see how a web site is doing. In Avinash's book, "Web Analytics An Hour A Day", he describes the Web Analytics trinity, a framework for understanding "Why customers visit", "Who actually visits", and "What Happens when they visit". I propose to expand the trinity to "How is the Web Site Doing?" and that is why we use performance monitoring.

The critical issue not found with Web Analytics is the critical metric of Time. "How are we doing?" easily goes to "When did it Happen?" Most web analysis does not account for time, since the insights are more strategic in nature. Performance Monitoring is more operational in nature to provide valuable insight into how the site is reacting "Right Now".

Tuesday, January 13, 2009

The Crux is the Business Process

From my background in rock climbing, the hardest part of the climb is called the 'crux'. It's the pivotal point in the whole application performance business. Why you ask? Because business people think this way, and so do the web site customers. People don't think servers and disk drives. When discussing Business Processes, IT can get the business engaged. Now you provide a Business Process, SLM-driven metric dashboard, and you've got everyone up the mountain, past the hard parts and on the path to optimal metrics and business nirvana!

The following graphic shows this exactly:

Note: This Graphic is from the following article: http://www.enterpriseleadership.org/c/journal/view_article_content?groupId=32294&articleId=36254&version=1.0.

Now let's get a bit more concrete in this. Pick your favorite web site, any site. We'll pick a few. Let's take a look at Progressive.com. (Disclosure: they were my customer at Gomez and I am a auto insurance customer). When you load their home page, take a step back from your screen and what do you see.... first I notice the words "Get a Quote". Hmm. What is this? Right. It's a quoting process, enabled to get folks quick auto quotes. Hence it's a new customer acquisition tool. Do you think this is an important business process for Progressive? You bet. Inside the company, they probably know their conversion rate for this process. Looking further, you see 'Login', which is the self-service portal. Wouldn't it make sense to monitor this login process to make sure the customer can always log in? Absolutely.

It becomes much easier to dialog about the 'login' process with customers and employees, especially on the business side. The old school IT view of talking about Weblogic Server 6788989 is slow doesn't really help anyone.

More About Business Processes

Think of a business process as a multiple page work flow or use case that end users navigate on a web site. For example, an end user who logs into their bank to look up their latest account transactions usually navigates three pages to get their answer.

In addition to monitoring breadth, business process work flows provide the richest and most valuable performance data for analytical purposes. These work flows usually require data from most of an organization's technical infrastructure, including global load balancers, web servers, application servers, message queues, and numerous database servers. Monitoring all the key business processes not only provides critical end user performance metrics, but also helps in quickly identifying performance issues in the infrastructure.

Sample Business Processes

The following processes are a sample of what you find out on the web today:
  • Account Status. For many organizations, such as those in financial services, retail, or manufacturing, critical customer information such as account, order, or shipping status. This product usually requires three steps: one to login to the site, one to display the summary, and one to logout.
  • Search for Product . Most sites work hard on search engines. Improving their search engine are critical to many in the retail and travel industry. Search for Product usually has two or three steps. First the keyword search box, the search results page, and then the item description.
  • Account Registration. Whether registering for a site profile, online gaming, an email account, or product sweepstakes, product managers want to get people registered to deliver personalization and cross selling products later. Financial institutions are registering users for online banking and trading stocks. These products have two or three pages, one where the user enters form information and the final confirmation page.
  • Service Application. A difficult product is the service application, whether applying for a credit card, filling out a tax return, health insurance claim, or consumer item rebate. These products are front ends to complex business processes. As more organizations move to compress the process time line, managing the end user and the work flow through third parties is critical.
  • Shopping Cart. For retail and financial institutions, this is the key to booking revenue. Getting the customer to choose a product they desire and then get the order placed is a very important focus. These products focus on three main steps, Add to Cart, Llogin page, then navigation to final order step.
  • Generate Report. Many service providers provide value by producing charts or data reports. These product managers aggressively work to improve the experience of the service. These products have three steps, beginning with a site login, navigating to a reports page, selecting report parameters, and generate the report.
As seen the attached figure, an Account Status business process can be broken down into steps that impact each part of the technical infrastructure. Building such sequence diagrams is very useful to discuss each process across internal and external organizations.

Monday, January 12, 2009

Why SLM Matters

Service Level Management (SLM) the ability to help organizations monitor application performance against a defined set of objectives agreed to by either internal or external service providers. By proactively managing SLM performance, organizations can:
  • Provide a collaborative and productive environment to discuss issues
  • Leverage independent metrics are easy to distribute via reports
  • Focus on end user and business process perspectives rather than internal event systems
There are dozens of organizations, consultants, and web sites which discuss Service Level Management (SLM), and as usual, the terminology and your mileage will certainly vary. In the context of Optimal Metrics, SLM matters because it really helps to focus the organization and it's partners on the customers. In my Internet searching, most of the content on this topic of Service Level Management discusses the ITIL framework. It is a great framework and management tool, but it really is not a methodology. While I do like strategic frameworks, the engineer in me loves to jump into the process, technology, and people to get things done.

The closest reference I have found is 'Implementing Service Level Management' and the article has two wonderful pictures that sum up most of my approach to understanding SLM:


The summary of this great article is that the way to implement SLM is to leverage Performance Management disciplines to manage and monitor business processes.

Another way to look at SLM is from the top down. Many in IT do things the other way, from the bottom up. As the diagram shows, focusing on technology components, such as routers, switches, and servers makes for a complicated approach. How do you measure across all the devices? With a router you can measure throughput in Megabytes per second. A server can toss out SNMP trap alerts when the processor goes more than 80% busy. And what does all this do to manage the application? Event and Alert management is great for the IT Operations team to know if the component is broken, but rarely can it directly tell you that the business process is not working right.

So, in summary, the reason behind SLM is to provide metrics and management insight into the technology. This is key to running IT inside a company, or even more when outsourcing occurs. SLM disciplines are required more and more as IT is disintermediated outside of the IT department. Think about the components in your standard B2C page: analytics, ads, content, CDNs, data centers. A lot of content is outside your control, so how do you make sense of it? How do you insure the provider is doing the right thing?

Tuesday, January 6, 2009

Why Optimal Metrics?

In my experience in supporting Internet facing applications over the past ten years, I have observed organizations of all types (such as commercial, non-profits, education, or government) progress in their discipline to manage their Internet application service for their customers. There are many converging forces in the market that continue this progression. Certainly the current economic crisis moves companies to focus on reducing cost instead of investing in growth, but the leveraging of technology also drives other trends (such as out-sourcing labor, cloud computing and visualization, and software simplicity). This convergence of business and technical market changes also provide the opportunity to strive for optimal integration of management tools, disciplines, and most importantly, metrics.

Depending on the organization and the purpose for their web sites, each one will use different disciplines and tools. For instance, most Marketing organizations leverage Web Analytics to better drive insight into the marketing discipline. Ten years ago, the key metric was "visits" to answer the basic question of how many people were visiting the site. Visits would then justify the marketing expense of the site. Today, companies are doing more complex analysis to define metrics such as "Landing Page Bounce Rate". Today's web analytic leaders are pushing to now integrate the online and offline metrics together, trying to build more predictive and optimal models and metrics to develop leading indicators of their business.

Internet Performance Management has also established itself as a standard way to measure a site's performance with metrics such as "Response Time" or "Availability." These approaches provide baselines for key applications or web pages for many purposes. For example, they can provide early warning to detect problems before customers do, show Internet routing problems as they begin to happen, or determine if the ad vendor is slowing down the page. Most organizations use these tools to insure that their customers web experience are as best as possible. As more and more of the web site dis-intermediate to third parties, businesses are driving these tools to reduce time to respond to site issues and manage their service providers.

Business-driven management approaches such as Balanced Scorecards or Six Sigma have been successful in managing traditional business. With more and more web businesses adopting these business approaches, the key desire is to be able to integrate the strategies and tactics at the business, monitor the processes, and manage to success. Whether a rail company, airline, or online book store, merging the metrics and building effective dashboards is management nirvana.

For over forty years, from the mainframe to the Internet, organizations have applied frameworks to better manage their business. They started with Decision Support Systems, which then lead to Data Warehousing in the 1980's, and then to Business Intelligence in the 1990's, and are now moving to today's Web Intelligence. Pooling all the internal customer care systems, billing systems, and sales management systems together, building a multi-channel view of the organization, drives Web Intelligence to optimal metrics.

All these converging business and technology threads point to the strategic goal of achieving optimal metrics. When both business and technology align and are transparent to each employee or customer, organizations can finally reach the vision of true organizational integration. This blog is all about the topics on this convergence. By striving for optimal metrics within your organization, your employees and customers will excel in their online experience and love to return.