Showing posts with label Performance Monitoring. Show all posts

Friday, March 12, 2010

Performance Challenge: The Misconfiguration

There are a number of performance challenges that many websites find themselves, but nothing worse than the Misconfiguration. Last week, a customer noted that "my site seems very slow." So I fired up Gomez and started testing. The page was very heavy at over 1.5 Mbytes, but still, 70 seconds on average was terrible! I drilled into the data on behalf of the customer and saw swings of excessively long Content Download times, which usually indicates something is misconfigured with the web server. Note the graph showing the oscillation up and down. Not only are things slow, but swinging wildly, totally inconsistent.

So how did things get fixed?

The engineers looked at the switch ports and found this:

#sho int g2/370
GigabitEthernet2/370 is up, line protocol is up (connected)
Hardware is C6k 1000Mb 802.3, address is 001f.ca6f.8424 (bia 001f.ca6f.8424)
Description: serverwww:eth0
MTU 1500 bytes, BW 100000 Kbit, DLY 10 usec,
reliability 255/255, txload 1/255, rxload 1/255
Encapsulation ARPA, loopback not set
Keepalive set (10 sec)
Full-duplex, 100Mb/s, media type is 10/100/1000BaseT
input flow-control is off, output flow-control is off
Clock mode is auto
ARP type: ARPA, ARP Timeout 04:00:00
Last input never, output 40w2d, output hang never
Last clearing of "show interface" counters 00:21:11
Input queue: 0/2000/389/0 (size/max/drops/flushes);
Queueing strategy: fifo
Output queue: 0/40 (size/max)
5 minute input rate 0 bits/sec, 0 packets/sec
5 minute output rate 0 bits/sec, 0 packets/sec
4114 packets input, 4232945 bytes, 0 no buffer
Received 21 broadcasts (0 multicasts)
2 runts, 0 giants, 0 throttles
389 input errors, 108 CRC, 0 frame, 0 overrun, 0 ignored
0 watchdog, 0 multicast, 0 pause input
0 input packets with dribble condition detected
4400 packets output, 1192528 bytes, 0 underruns
0 output errors, 0 collisions, 0 interface resets
0 babbles, 0 late collision, 0 deferred
0 lost carrier, 0 no carrier, 0 PAUSE output
0 output buffer failures, 0 output buffers swapped out

So basically, the silly ports on the switch and the server were in a mismatch. Packets were getting dropped or munged between the switch and the server. After manually checking both sides and making sure everything was set, the performance impact was HUGE! Think of over 55 seconds on average. WOW!

So ... checking all the silly details gives us huge wins for the customer. Another misconfiguration win!

Thursday, March 4, 2010

Performance Dashboards

Back the early Internet age, I was a consultant helping build marketing data warehouses. There were a number of great spokes-persons of our niche industry, notably Ralph Kimball and Bill Inmon. Both published a lot of books and both educated many of us on critical data management issues. A rising star from those days was Wayne Eckerson, who became the Business Intelligence guru. Wayne published a great book, Peformance Dashboards, which really leverage the 1990's wave in data warehousing with the web analytics of this decade, blending the metrics to deploy business performance dashboards.
The key summary of this book is that dashboards, scorecards, metrics, monitoring, and analytics all get munged into one screen of information. Keeping the key things simple to understand makes it easier for the entire company to focus their efforts and work to making things better for the customer. The dashboard translates strategy into objectives, metrics, and initatives for each team to achieve.

My favorite dashboard that combines the world of the web, data warehouse, and basic business systems is that from the Indiana Musuem of Art.

They have combined all the great metrics to run their business on published it on the web. Just think how you could transform your web site infrastructure and make this your Intranet. All the employees (and even customers!) can see what is important to the company. Clicking on a KPI gives you the trends over time and they even have "cross-selling" references on the left of the page. Totally a wonderful example.

Wednesday, March 25, 2009

Leverage YSlow for Performance

A couple of years ago, the smart folks at Yahoo realized a wonderful tool called YSlow. This is a plug-in for the Firefox browser that leverages another wonderful plug-in called Firebug. These two tools are a must for anyone in the business of web performance monitoring.

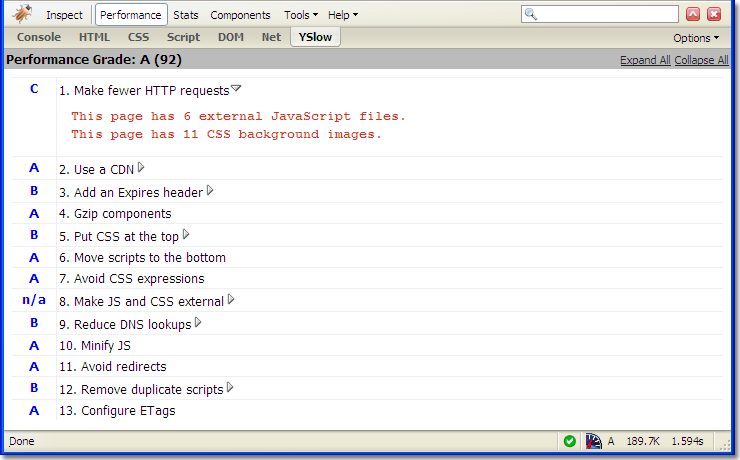
YSlow does a number of things, but the best place to start is the performance summary of a web page:


As you can see from the picture on the YSlow site, it will rank the web page under the YSlow 13 Performance categories. While it may not be the be-all end-all answer to solving your web performance tools, it really does give you a good start and a model to manage your web site's peformance. What is really the best part is that others can use it (since it's free to anyone) and get the same results that you do. The hardest part in discussing performance is establishing baselines to optimize and the Yahoo performance best practices are certainly worth leveraging.

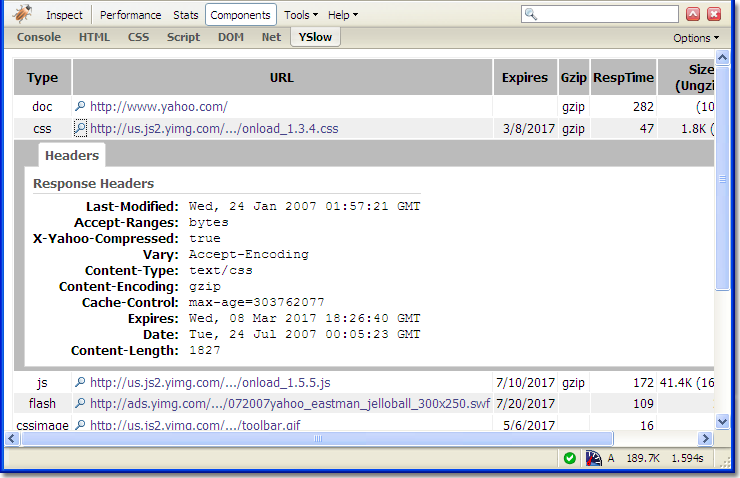
But the best part of YSlow is the full object download option. Yahoo calls this the web page components, but it shows you all the objects that compose your page in a "waterfall" view, which gives you a poor man's view of performance (versus the one provided by Gomez).

The component view shows you all you need to uncover the performance hairballs of your site. All the large objects, any MIME-type mismatches, IP address of the source. Awesome.

In summary, YSlow is an amazing tool and provides the Performance Analyst a wonderful tool to help customers optimize their web sites.

Tuesday, February 3, 2009

Why Performance Monitoring?

In understanding Service Levels for Web Sites, moving quickly to how to measure for SLAs, we quickly turn to Performance Monitoring to see how a web site is doing. In Avinash's book, "Web Analytics An Hour A Day", he describes the Web Analytics trinity, a framework for understanding "Why customers visit", "Who actually visits", and "What Happens when they visit". I propose to expand the trinity to "How is the Web Site Doing?" and that is why we use performance monitoring.

The critical issue not found with Web Analytics is the critical metric of Time. "How are we doing?" easily goes to "When did it Happen?" Most web analysis does not account for time, since the insights are more strategic in nature. Performance Monitoring is more operational in nature to provide valuable insight into how the site is reacting "Right Now".